
The Walk Score algorithm awards points based on the distance to the closest amenity in each category. If the closest amenity in a category is within .25 miles (or .4 km), we assign the maximum number of points. The number of points declines as the distance approaches 1 mile (or 1.6 km)—no points are awarded for amenities farther than 1 mile. Each category is weighted equally and the points are summed and normalized to yield a score from 0–100. The number of nearby amenities is the leading predictor of whether people walk.
https://en.wikipedia.org/wiki/Walk_Score

Walk Score measures the walkability of any address, Transit Score measures access to public transit, and Bike Score measures whether a location is good for biking.
The Walk Score methodology was developed with the Walk Score advisory board and has been validated by leading academic researchers.
Planners and Analysts: Learn about using Walk Score data in your research.
Walk Score
Walk Score measures the walkability of any address using a patented system. For each address, Walk Score analyzes hundreds of walking routes to nearby amenities. Points are awarded based on the distance to amenities in each category. Amenities within a 5 minute walk (.25 miles) are given maximum points. A decay function is used to give points to more distant amenities, with no points given after a 30 minute walk.
Walk Score also measures pedestrian friendliness by analyzing population density and road metrics such as block length and intersection density. Data sources include Google, Factual, Great Schools, Open Street Map, the U.S. Census, Localeze, and places added by the Walk Score user community.
| Walk Score® | Description |
|---|---|
| 90–100 | Walker’s Paradise Daily errands do not require a car. |
| 70–89 | Very Walkable Most errands can be accomplished on foot. |
| 50–69 | Somewhat Walkable Some errands can be accomplished on foot. |
| 25–49 | Car-Dependent Most errands require a car. |
| 0–24 | Car-Dependent Almost all errands require a car. |
Find apartments in the most walkable large U.S. cities: New York, San Francisco and Boston. Find real estate in New York, San Francisco, and Boston.
Transit Score
Transit Score is a patented measure of how well a location is served by public transit. Transit Score is based on data released in a standard format by public transit agencies.
To calculate a Transit Score, we assign a “usefulness” value to nearby transit routes based on the frequency, type of route (rail, bus, etc.), and distance to the nearest stop on the route. The “usefulness” of all nearby routes is summed and normalized to a score between 0 – 100.
View a map of where we provide Transit Score — or for a full Transit Score geek out, read the detailed Transit Score methodology.
| Transit Score® | Description |
|---|---|
| 90–100 | Rider’s Paradise World-class public transportation. |
| 70–89 | Excellent Transit Transit is convenient for most trips. |
| 50–69 | Good Transit Many nearby public transportation options. |
| 25–49 | Some Transit A few nearby public transportation options. |
| 0–24 | Minimal Transit It is possible to get on a bus. |
Find apartments in the highest transit ranking U.S. cities: New York, San Francisco and Boston. Find real estate in New York, San Francisco, and Boston.
Bike Score

Bike Score measures whether an area is good for biking. For a given location, a Bike Score is calculated by measuring bike infrastructure (lanes, trails, etc.), hills, destinations and road connectivity, and the number of bike commuters.
These component scores are based on data from the USGS, Open Street Map, and the U.S. Census.
Read the detailed Bike Score methodology.
| Bike Score | Description |
|---|---|
| 90–100 | Biker’s Paradise Daily errands can be accomplished on a bike. |
| 70–89 | Very Bikeable Biking is convenient for most trips. |
| 50–69 | Bikeable Some bike infrastructure. |
| 0–49 | Somewhat Bikeable Minimal bike infrastructure. |
Find apartments in the most bikeable large U.S. cities: Portland, San Francisco and Denver. Find real estate in Portland, San Francisco, and Denver.
Crime Grade
B
The Crime Grade measures your personal (violent) crime risk and property crime risk near an address on an A – D scale using a patent-pending system. Our crime data is imported directly from police departments.
To compute the Crime Grade we aggregate crimes near an address and weight them by severity and distance. We calculate a per capita crime rate for an address based on the resident and worker population in the area. Crime rates are then compared against city-wide rates and converted into a letter grade.
| Crime Grade | Description |
|---|---|
| A | Lowest Crime Area Safest 25% of neighborhoods. |
| B | Lower Crime Area Safer than average neighborhood. |
| C | Average Crime Area Talk to the neighbors to learn more. |
| D | Higher Crime Area Least safe 10% of neighborhoods. |
City & Neighborhood Rankings
 Walk Score Point Grid
To rank cities and neighborhoods, we calculate the Walk Score of approximately every city block (technically a grid of latitude and longitude points spaced roughly 500 feet apart).
Each point is weighted by population density so that the rankings reflect where people live and so that neighborhoods and cities do not have lower scores because of parks, bodies of water, etc.
For our Walk Score ranking, we define “large cities” as the 50 largest U.S. cities. For our Transit Score and Bike Score ranking, we define “large cities” as cities with more than 300,000 people.
https://www.walkscore.com/methodology.shtml

Walkability, Real Estate, and Public Health Data
Walk Score data is used by analysts and researchers in the fields of real estate, urban planning, government, public health, and finance.
Walk Score has received grants from the Rockefeller Foundation and the Robert Wood Johnson Foundation to align our algorithms with the latest academic research.
Walk Score data is available in a variety of formats including shapefiles, spreadsheets, and via our APIs. We can provide Walk Score data for individual addresses or larger geographic areas like postal codes. Walk Score data is available in the United States and Canada. Walk Score and Transit Score are patented systems, multiple other patents are pending.
With our subscription services, Walk Score data can be tracked over time to measure historical trends. For example, the percentage of residents in a city who can walk to fresh food in 5 minutes.
Data Products
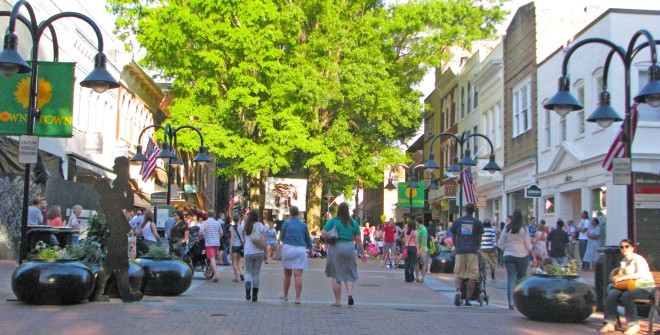
In U.S. cities, homes within walking distance to jobs, schools, shopping, parks and other urban amenities are both highly desired and extremely rare. Fewer than 2 percent of active listings are considered a walker’s paradise (Walk Score of 90 and above). Yet 56 percent of millennials and 46 percent of boomers prefer walkable communities with a range of housing amidst local businesses and public services. And like everything rare and desirable, walkability comes at a premium; homes highly “walkable” to amenities, everything else being equal, are more expensive than comparable homes in less “walkable” areas.
To estimate how much walkability is worth when buying or selling a home, we looked at the sale prices and Walk Score ratings of more than one million homes sold between January 2014 and April 2016 across 14 major metro areas to determine the average price of one Walk Score point.
We found that one Walk Score point can increase the price of a home by an average of $3,250 or 0.9 percent.
Here are the price premiums of one point of Walk Score on a home by metro area:
| Metro Area | Walk Score | Median Sale Price | $ Premium of 1 Walk Score Point on Median Home Price | % Premium of 1 Walk Score Point on Median Home Price |
| Atlanta | 48.4 | $168,000 | $2,838 | 1.69% |
| Baltimore | 68.7 | $229,900 | $652 | 0.28% |
| Boston | 80.7 | $325,000 | $3,927 | 1.21% |
| Chicago | 77.5 | $220,000 | $2,437 | 1.11% |
| Denver | 59.9 | $285,000 | $2,410 | 0.85% |
| Los Angeles | 66.3 | $475,000 | $3,948 | 0.83% |
| Oakland | 71.6 | $523,000 | $1,735 | 0.33% |
| Orange County | 43.5 | $580,000 | $114 | 0.02% |
| Phoenix | 40.3 | $204,900 | $217 | 0.11% |
| Portland | 63.9 | $275,000 | $1,210 | 0.44% |
| San Diego | 49.9 | $449,000 | $2,205 | 0.49% |
| San Francisco | 85.7 | $950,000 | $3,943 | 0.42% |
| Seattle | 72.9 | $375,000 | $3,603 | 0.96% |
| Washington DC | 77.0 | $360,000 | $4,386 | 1.22% |
These estimates compare homes by controlling for differences in property and neighborhood characteristics, including property size, number of bedrooms and bathrooms, age of the building, type of property (single-family, condo or townhouse), neighborhood median income and total employment, as well as controls for market conditions (appreciation over time). In all 14 metro areas, a home located in a more walkable neighborhood was more expensive than the same home in a less walkable location.“Outside of Midtown, walkable homes are a rarity in Atlanta,” said Redfin agent Sascha Gummersbach. “But that’s changing as new, walkable developments across the area, like Avalon in Alpharetta and revitalization efforts in the historic downtowns of Woodstock and Roswell are creating more opportunities for convenience-minded homebuyers. Several of my clients who have sold homes in Midtown and other walkable areas have opted to move nearby, even closer to the restaurants and bars they love walking to, rather than move out to bigger homes.”
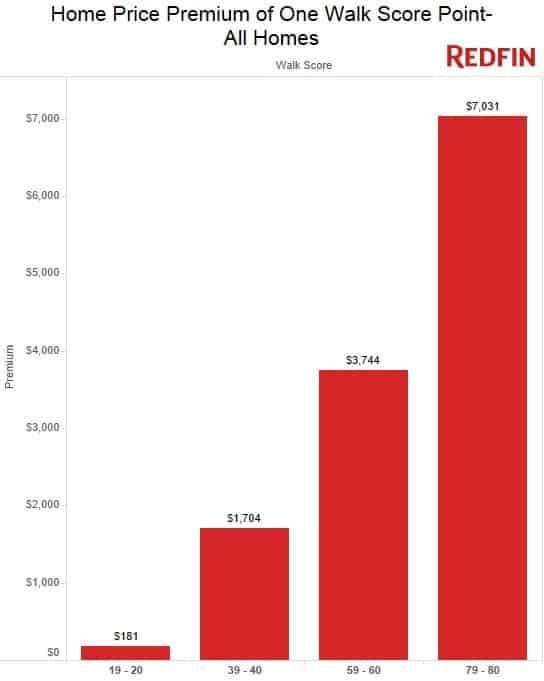
Not all Walk Score points create equal value. An increase in Walk Score from 19 to 20 resulted in a home price increase of about $181 on average across the metros. On the other hand, moving from a location with a Walk Score of 79 to that with a score of 80 resulted in a home price increase of over $7,000.
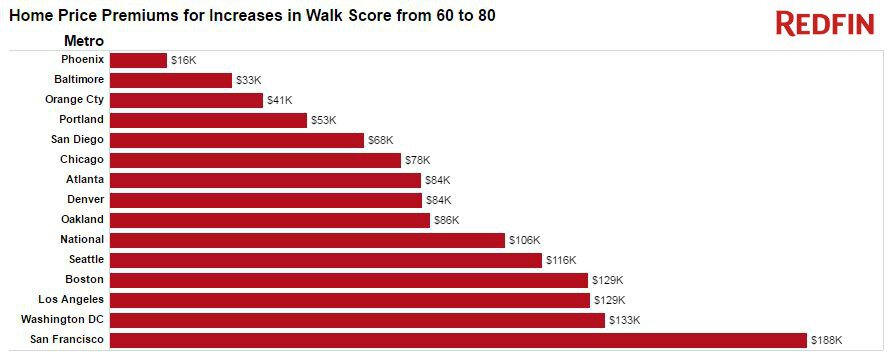
The results differed by metro area as well. For example, a change in Walk Score from 60 to 80 in San Francisco increased a comparable home’s value by $187,630, but in Phoenix the increased walkability only adds $15,700. The price premiums accelerate even more as the Walk Score gets closer to 100, implying high demand relative to supply for homes in high scoring city areas. The overall price impact as a percentage of the median home price in a metro was 22 times greater in San Francisco than in Orange County.
These premiums show that people pay more for homes in areas with a high Walk Score, even when adjusting for other factors. With this in mind, policy makers, real estate developers and investors can do two things. First, they can work to build more homes in areas with high Walk Score ratings, thereby increasing the supply of homes and giving more people an opportunity to live in these areas. Second, they can work to increase the Walk Score of city areas, thereby bringing walkability to the places people already live.
Luxury Homes
Is the value of a Walk Score point worth more or less for luxury homes? Looking at the top 5 percent of homes by sale price, we find that one Walk Score point can increase the price of a luxury home by $6,800 or 0.55 percent, on average across the 14 metro areas. Furthermore, within all metros other than Orange County, luxury home owners were willing to pay a higher dollar premium for a point of Walk Score. These premiums made for a lower percentage of the luxury home price.
| Metro Area | Walk Score | Top 5% Home Price | $ Premium of 1 Walk Score Point on Top 5% Home Price | % Premium of 1 Walk Score Point on Top 5% Home Price |
| Atlanta | 48.4 | $580,000 | $5,424 | 0.94% |
| Baltimore | 68.7 | $631,690 | $1,757 | 0.28% |
| Boston | 80.7 | $985,000 | $7,385 | 0.75% |
| Chicago | 77.5 | $680,000 | $5,581 | 0.82% |
| Denver | 59.9 | $685,000 | $5,230 | 0.76% |
| Los Angeles | 66.3 | $1,800,000 | $8,225 | 0.46% |
| Oakland | 71.6 | $1,365,000 | $4,384 | 0.32% |
| Orange County | 43.5 | $1,728,000 | $(451) | -0.03% |
| Phoenix | 40.3 | $585,000 | $277 | 0.05% |
| Portland | 63.9 | $630,000 | $1,944 | 0.31% |
| San Diego | 49.9 | $1,299,000 | $6,511 | 0.50% |
| San Francisco | 85.7 | $3,000,000 | $8,077 | 0.27% |
| Seattle | 72.9 | $1,000,000 | $5,119 | 0.51% |
| Washington DC | 77.0 | $930,000 | $7,245 | 0.78% |
Leigh Kamping-Carder also researched this topic for the Wall Street Journal. Read her article here.“Luxury in Orange County is all about exclusivity and seclusion,” said Redfin agent Vickie Melin, who is currently listing this $3.8 million, 9-bedroom, 9.5-bathroom mansion with a Walk Score of zero in Villa Park, California. “People in Orange County love their cars and don’t give driving a second thought as it’s the easiest and most convenient way to get around the area. When my clients think of walkability, they think about walking, biking, and even horse-riding paths used more for recreation than transportation.”
With Nela Richardson and Eric Scharnhorst
Methodology:
A statistical technique called hedonic regression was used to estimate how much market value homebuyers implicitly attach to houses with higher Walk Score. This type of regression modelling is essentially what appraisers do when they carry out a “comps” analysis. Properties are heterogeneous, each with different characteristics and locations and they transact at different times under a range of market conditions. A regression is used to make an apples-to-apples comparison between properties by controlling for these differences and compare the prices of properties with different Walk Score ratings “all else being equal”.
The hedonic regression method was also used by a 2009 study, “Walking the Walk: How Walkability Raises Home Values in U.S Cities” by Joe Cortright of Impressa, Inc. The variables used in the present analysis are similar to those in the 2009 study with the exception of distance to central business district, which was unavailable for our data. In addition, we also control for historical time or real estate market conditions and find that the price premiums accelerate as Walk Score gets closer to 100.
https://www.redfin.com/blog/how-much-is-a-point-of-walk-score-worth/